Data driven decision making has become essential in today’s business landscape, with 91% of businesses now implementing digital-first strategies. In an era where companies collect more data than ever before, relying solely on gut instinct no longer suffices for making critical business decisions.
We understand that data analysis transforms raw information into valuable insights, revealing patterns and opportunities that would otherwise remain hidden. Additionally, organizations that leverage data-driven approaches gain a significant competitive advantage over those still making decisions based on subjective experiences. The benefits of data analysis in business extend across multiple areas, particularly in forecasting, customer insights, and operational efficiency. Furthermore, as data analytics continues to evolve as a strategic asset driving growth, the demand for skilled professionals in this field is projected to grow 11% over the next decade—significantly faster than the average for all occupations.
In this article, we’ll explore practical data analysis techniques that can help your organization make smarter business decisions. From identifying the right problems to solve, to choosing appropriate analytical approaches and measuring their impact, we’ll provide a comprehensive guide to implementing effective data driven strategies in your business operations.
Identifying Business Problems That Need Data Analysis
Successful data analysis begins not with the data itself, but with a clear understanding of the business problems you need to solve. According to McKinsey experts, the most effective approach “starts not with the data, but with identifying a business opportunity and determining how the model can improve performance”. This distinction is crucial since many organizations rush to implement data solutions without first establishing what they’re trying to accomplish.
Setting Clear Objectives for Data-Driven Strategy
Effective data-driven strategy requires well-defined business objectives that provide direction and purpose for your data initiatives. When formulating these objectives, it’s essential to gain a deep understanding of your company’s strategic goals. This means meeting with department leaders and decision-makers to clarify what success looks like for your organization. Through these conversations, you’ll discover what drives your business and how data can support those drivers.
The most effective organizations achieve strategic alignment through three essential layers: strategy, goals, and objectives. This structured approach ensures that every data initiative serves a specific business purpose rather than existing as an isolated technical function. Subsequently, data leaders must translate broad business goals into precise, actionable initiatives by asking sharp, answerable questions.
A design-thinking approach can help surface organizational pain points, bringing strategic value across multiple use cases, lines of business, and individual teams. This process helps generate achievable resolutions in a continuous cycle of observation, reflection, and creation—approaching problems and solutions as an ongoing conversation.
When defining your data-driven objectives, consider these key questions:
Which business initiatives should be prioritized?
What challenges are preventing us from achieving our priority objectives?
What problem areas can be improved with better access to high-quality data?
How do you measure success for yourself and your teams?
These questions will guide you toward identifying specific business problems that data analysis can help resolve, whether it’s increasing revenue, reducing costs, improving customer satisfaction, enhancing operational efficiency, or staying ahead of competition.
Aligning Data Goals with Business KPIs
Once you’ve identified your business objectives, the next critical step is aligning your data goals with specific Key Performance Indicators (KPIs). These metrics serve as bridges between raw data and business impact, providing measurable outcomes that everyone can track and understand.
For each business objective, identify the metrics that directly reflect progress. For instance, if your goal is increasing customer retention, relevant KPIs might include customer lifetime value, churn rate, and net promoter score. Similarly, for improving operational efficiency, you might focus on cycle time, cost per unit, or resource utilization.
KPIs play several critical roles in data projects, including defining clear objectives, measuring outcomes, and facilitating troubleshooting. Moreover, when KPIs are properly aligned with strategic goals, they create a culture of accountability where every team and individual understands how their work contributes to the bigger picture.
It’s important to note that effective KPIs must be connected to core business goals tied to the organization’s success. Therefore, top-level goals must cascade into departmental and individual-level key performance goals. As a result, when each function owns their role in achieving corporate goals, it creates a multiplier effect on overall performance.
Regularly assess whether your KPIs are still aligned with strategic priorities, are driving the right behaviors, and whether teams have access to the tools and data they need. This ongoing evaluation ensures your data analysis efforts remain relevant and continue supporting your business strategy as market conditions evolve.
Choosing the Right Data Analysis Technique
Data Analysis Techniques For Driving Smarter Business Outcomes
“Data science is a combination of three things: quantitative analysis (for the rigor required to understand your data), programming (to process your data and act on your insights), and narrative (to help people comprehend what the data means).” — Darshan Somashekar, Data Science Expert at Coresignal
After identifying business problems and aligning data goals with KPIs, selecting the appropriate data analysis technique becomes crucial for extracting meaningful insights. Understanding which technique to use—and when—can dramatically improve the effectiveness of your data driven decision making processes.
When to Use Descriptive vs Predictive Analytics
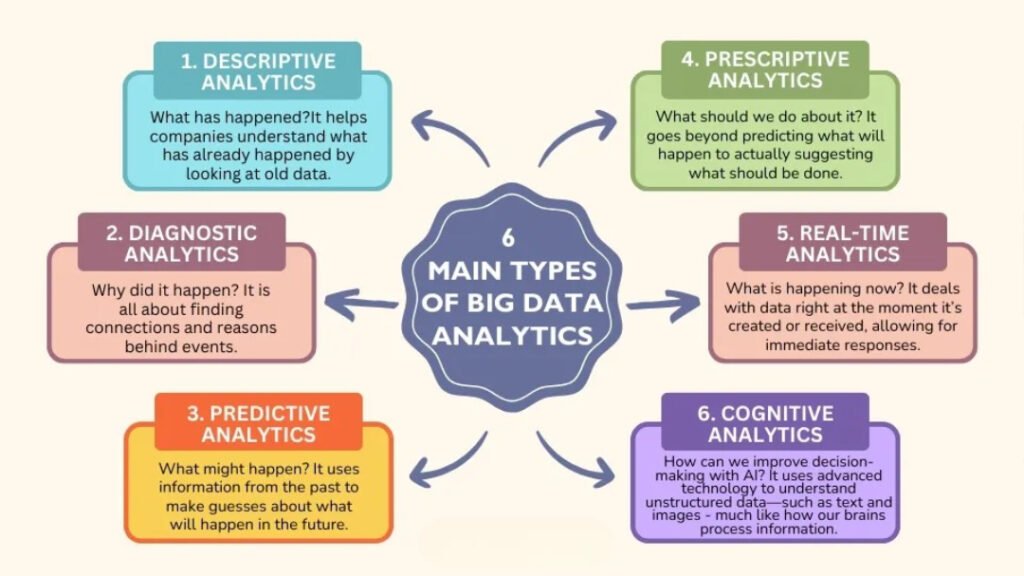
Descriptive analytics examines historical data to answer the question “What happened?” This foundational technique summarizes past events, identifies patterns, and provides context for business performance. Essentially, it serves as the starting point for all data analysis efforts—before making improvements or forecasting, businesses need a clear understanding of their current state.
Predictive analytics, meanwhile, uses historical data to forecast future outcomes, answering “What could happen?”. This technique employs statistical algorithms and machine learning to identify the likelihood of future outcomes. Consider implementing predictive analytics when you need to:
Forecast customer demand and optimize inventory
Predict maintenance issues and part breakdowns
Assess credit risk and identify potential fraud
Anticipate customer churn by identifying dissatisfaction signals
The key distinction lies in their objectives—descriptive analytics provides clarity about past events, whereas predictive analytics generates forecasts. Consequently, your choice depends primarily on whether you’re seeking historical understanding or forward-looking insights.
Combining Diagnostic and Prescriptive Approaches
Diagnostic analytics builds upon descriptive techniques by explaining why certain trends or events occurred. This approach uncovers causal relationships in data, addressing the critical question of why an occurrence or anomaly appeared. Data Analysis Techniques For Driving Smarter Business Outcomes.
Prescriptive analytics, forth, takes predictive insights and recommends specific actions to achieve desired outcomes. It uses optimization and simulation algorithms to guide the best course of action. Notably, this approach helps with:
Automatic adjustment of product pricing based on anticipated demand
Determining the most efficient delivery routes considering multiple factors
Flagging employees for additional training based on field reports
These techniques work synergistically—diagnostic analysis identifies root causes while prescriptive analysis suggests solutions. Until you understand why sales decreased 20%, attempting to predict future sales becomes significantly less effective.
Using Exploratory Analysis for Hypothesis Testing
Exploratory Data Analysis (EDA) involves investigating data sets without specific assumptions, often employing visualization methods to understand patterns and relationships. This technique helps determine how to manipulate data sources effectively while making it easier to discover patterns and spot anomalies.
EDA specifically supports hypothesis testing by:
Providing a foundation to examine data before making assumptions
Helping identify obvious errors and better understand patterns
Detecting outliers and anomalous events
Finding interesting relationships among variables
Through exploratory analysis, data scientists can validate assumptions and make informed decisions. This process confirms they’re asking the right questions while ensuring results are applicable to business outcomes. During hypothesis testing, EDA helps extract insights about associations between different variables, confirming intuitions about their relationships.
The right data analysis technique aligns with your specific business goals, data types, and the questions you’re trying to answer. By thoughtfully selecting and combining these approaches, you’ll transform raw information into actionable business intelligence that drives smarter decision making. Data Analysis Techniques For Driving Smarter Business Outcomes.
Implementing Data Analysis in Business Workflows
Turning data analysis into actionable business value requires systematic implementation across your organization. In fact, data remains fragmented without a structured workflow, delaying insights and crippling operational decisions. Data Analysis Techniques For Driving Smarter Business Outcomes.
Data Collection and Cleaning Best Practices
Clean, high-quality data forms the foundation of effective analysis. First, establish specific data quality criteria including accuracy, timeliness, freshness, completeness, consistency, validity, uniformity, and integrity. For structured implementation, create a comprehensive data cleaning plan that includes:
Removing unwanted observations and outliers
Standardizing data structure and entry formats
Fixing cross-set errors and syntax issues
Addressing missing data
Validating results
Automation plays a crucial role in maintaining data quality at scale. Tools like OpenRefine, Trifacta Wrangler, and IBM Infosphere Quality Stage can save considerable time. Above all, schedule routine cleaning at regular intervals—monthly, quarterly, or annually depending on your data volume. Data Analysis Techniques For Driving Smarter Business Outcomes.
Tool Selection: BI Platforms, ML Models, and Dashboards
Selecting appropriate analysis tools requires matching capabilities to your specific business needs. BI tools transform raw data into actionable insights by collecting, integrating, cleansing, and visualizing information. When evaluating options, consider:
Data integration capabilities across multiple sources
Customization alignment with company requirements
Collaboration features for cross-team analysis
Security measures and compliance standards
Infrastructure compatibility with existing systems
Modern platforms typically offer visualization dashboards, predictive modeling, statistical analysis, data mining, and ad-hoc reporting. Popular options include Microsoft Power BI (user-friendly, Microsoft integration), Tableau (strong visualization), KNIME (visual interface for non-programmers), and Python/R (for teams comfortable with code).
Integrating Data Analysis into Daily Operations
For this purpose, implementation should follow a structured approach. Begin by setting clear objectives for what challenges your data initiatives will address. Next, take inventory of your data sources, storage locations, and connections before cleansing and preparing data for analysis.
Coupled with proper preparation, integration requires embedding data-driven decision making into regular workflows. Consider introducing analytics tools through phased rollouts or pilot programs, starting with a single department to refine practices before scaling. Throughout implementation, maintain close monitoring of performance metrics and user adoption rates through regular dashboard reviews.
The best implementations establish robust data governance frameworks setting standards everyone must follow, ensuring quality, privacy, and security in an environment where humans produce 149 zettabytes of data annually. Data Analysis Techniques For Driving Smarter Business Outcomes.
Measuring the Impact of Data-Driven Decisions
“The pandemic has certainly shone a light on how important data and analytics are to a company’s ability to evolve practices and pivot in trying circumstances. As our work and personal lives continue to transform, strong data and analytics strategies that create insights in real-time will continue to power smart decisions that will separate winning organizations from the pack.” — Mike Capone.
Quantifying the success of data initiatives remains crucial for validating their business impact. Unlike traditional gut-based decision making, data-driven approaches require measurable evidence of their effectiveness. Data Analysis Techniques For Driving Smarter Business Outcomes.
Tracking ROI and Business Outcomes
Establishing clear measurement frameworks before implementation begins provides the most effective approach to proving analytics ROI. This requires identifying specific metrics tracked consistently over time and establishing baseline measurements reflecting current state inefficiencies. Developer productivity offers a highly measurable impact area, including tracking time required for data transformation tasks and pipeline failure frequency. Organizations that differentiate their application of objectives and key results (OKRs), key performance indicators (KPIs), and outcome-driven metrics (ODMs) have demonstrated higher levels of success.
First of all, focus on metrics directly tied to business outcomes. According to Forrester Consulting’s study, organizations achieved 194% return on investment, with breakeven within six months of implementation. Translate impact into language business leaders understand: “We reduced customer churn by 8% after implementing usage-based segmentation”.
Using A/B Testing for Strategy Validation
A/B testing (split testing) reduces uncertainty in decision-making by providing data-backed answers instead of relying on assumptions. This methodology enables organizations to:
Make careful changes while collecting impact data
Transform decisions from opinion-based to data-driven
Learn which elements most influence user behavior
Statistical significance indicates whether test results are reliable or simply random chance. When analyzing results, compare against your baseline (A version), look for statistically significant uplift, consider practical impact, and check alignment with other metrics. Data Analysis Techniques For Driving Smarter Business Outcomes.
Continuous Monitoring and Feedback Loops
Feedback loops transform decision-making from reactive to adaptive by creating closed systems where decisions generate outcomes, outcomes create data, and data refines future decisions. Throughout this process, the essential components include decision traceability, outcome measurement, and learning integration.
Ultimately, effective monitoring requires gathering baseline data, setting clear improvement goals, reviewing performance regularly, and adjusting parameters based on insights. Display decision cycles on dashboards—showing input, outcome, feedback, and next action—to maintain team alignment and transparency.
Case Studies of Data-Driven Decision Making
Real-world examples illustrate the tangible impact of data driven decision making across industries. These case studies demonstrate how organizations translate analytical insights into measurable business outcomes. Data Analysis Techniques For Driving Smarter Business Outcomes.
Data-Driven Decision Making in Healthcare: Reducing Readmission Rates
Hospital readmissions present critical challenges for healthcare organizations worldwide, with approximately 20% of Medicare patients readmitted within 30 days in 2011. One hospital group achieved a remarkable 20% reduction in readmissions by implementing business intelligence-generated insights. This success stems from predictive models that analyze historical patient data to identify individuals at high risk for complications or return visits. Electronic health record (EHR) systems play a pivotal role in this process, as demonstrated by a systematic review revealing EHR-based interventions reduced 30-day all-cause readmissions by 17% and 90-day readmissions by 28%.
Educational institutions likewise leverage data analytics to enhance student success. One large university centralized data across departments through dashboard implementation, providing leadership with comprehensive insights into enrollment trends, course fill rates, and faculty workloads. This approach yielded a 30% improvement in forecasting accuracy for semester enrollment. Effective educational data strategies typically follow five key recommendations: making data part of an ongoing instructional improvement cycle, teaching students to examine their own data, establishing clear schoolwide data vision, fostering data-driven culture, and developing districtwide data systems.
Retail Example: Personalizing Promotions Based on Purchase History
In retail, European Wax Center transformed operations by consolidating data from over 900 franchise locations into a single real-time dashboard. This integration yielded a 90% reduction in reporting time while providing executives visibility into key metrics like appointment volume and customer retention. Personalization efforts in retail demonstrate similar impact—companies implementing targeted promotions based on purchase history experience 1-2% sales lift and 1-3% margin improvement. Given these points, retailers increasingly shift promotional budgets toward personalized offers, with one convenience chain increasing investment from 1% to 10%, generating $250 million in incremental sales.
Conclusion
Data analysis has clearly emerged as a cornerstone for organizations seeking competitive advantage in today’s information-rich environment. Throughout this article, we explored how properly implemented data strategies transform raw information into actionable insights that drive measurable business outcomes.
Successful data initiatives begin with precise problem identification rather than simply collecting data for its own sake. After all, strategic alignment between business objectives and data goals creates the foundation for meaningful analysis. Accordingly, organizations must carefully select appropriate analytical approaches—whether descriptive, predictive, diagnostic, or prescriptive—based on specific business questions they aim to answer.
Implementation requires attention to data quality, tool selection, and seamless workflow integration. Clean data undoubtedly serves as the bedrock of reliable analysis, while suitable tools enable teams to extract valuable patterns and share insights effectively. Additionally, measuring impact through ROI tracking, A/B testing, and continuous feedback loops ensures data initiatives deliver tangible value.
The case studies across healthcare, education, and retail demonstrate how data-driven approaches yield remarkable results—from reduced hospital readmissions to improved educational outcomes and personalized retail experiences. These real-world examples certainly highlight the transformative power of data when properly harnessed.
Data analysis ultimately empowers smarter business decisions through evidence rather than intuition. Companies that embrace this approach will find themselves better equipped to navigate complex markets, understand customer needs, optimize operations, and drive sustainable growth. The path to data-driven excellence may present challenges, yet organizations that commit to this journey will unquestionably position themselves for long-term success in an increasingly competitive landscape.
Key Takeaways
Transform your business decision-making from gut instinct to data-driven insights with these essential strategies for implementing effective analytics that deliver measurable results.
Organizations that commit to evidence-based decision making position themselves for competitive advantage, with studies showing 194% ROI and breakeven within six months of proper implementation. Data Analysis Techniques For Driving Smarter Business Outcomes.
FAQs
Q1. How can businesses identify the right problems for data analysis?
Start by setting clear objectives aligned with your business strategy. Meet with department leaders to understand key challenges and prioritize initiatives that can be improved with high-quality data. Align your data goals with specific, measurable KPIs to ensure your analysis efforts support overall business outcomes.
Q2. What are the main types of data analysis techniques and when should they be used?
The main types are descriptive (summarizing past events), predictive (forecasting future outcomes), diagnostic (explaining why events occurred), and prescriptive (recommending actions). Use descriptive analytics for historical understanding, predictive for forecasting, diagnostic for root cause analysis, and prescriptive for action-oriented insights.
Q3. How can organizations effectively implement data analysis in their workflows?
Start by establishing data quality criteria and cleaning processes. Select appropriate tools like BI platforms and dashboards that match your needs. Integrate analysis into daily operations through phased rollouts, beginning with a single department. Maintain robust data governance frameworks to ensure quality, privacy, and security.
Q4. What methods can be used to measure the impact of data-driven decisions?
Track ROI by establishing clear measurement frameworks and baseline metrics before implementation. Use A/B testing to validate strategies by comparing outcomes against a control group. Implement continuous monitoring and feedback loops to refine decisions based on real-time data and outcomes.
Q5. Can you provide examples of successful data-driven decision making across industries?
In healthcare, one hospital group reduced readmissions by 20% using predictive models. An educational institution improved enrollment forecasting accuracy by 30% through centralized data dashboards. In retail, personalized promotions based on purchase history led to 1-2% sales lift and 1-3% margin improvement for some companies.